 Last week I introduced the idea of using two dyes to illustrate the power of ion exchange chromatography (IEC). The dyes were used instead of amino acids, but served to illustrate how the net charge on a molecule can be used as a means of purifying (preparative ion exchange chromatography) or simply analysing mixtures of molecules, such as amino acids (LHS). Consider the 4 of the amino acids found in proteins: Glutamate (Glu), Aspartate (Asp), Tyrosine (Tyr) and Lysine (Lys). In addition to their shared amino and carboxylate groups (which in large part define their properties as free amino acids), Glu and Asp have a second carboxylate group as the side chain. Thus at neutral pH, they carry a net negative charge. By comparison, Lys is positive, owing to an additional amino group, whilst Tyr is polar, but neutral, owing to the hydroxyl group attached to its aromatic side chain. Look the structures up at the wikipedia site and satisfy yourselves that you appreciate the chemical properties of each amino acid. Forthe purposes of the lab sessions I will focus on IEC, since gel filtration chromatography (sometimes called gel permeation), elegant though it is, has limited application and affinity chromatography is specific (by its very nature) to single classes of proteins. You will also have last year's experimental report on the use of Ni-NTA Affinity chromatography for the purification of tagged GFP. See my Blog here. The use of solvents and silica based resins in thin layer chromatography and high performance liquid chromatography, are discussed below.
Separation of the four molecular species discussed above, presents a real challenge, but one that has been solved by applying a range of chromatography methods. A second important part of any separation method is detection. Glu and Asp differ from each other only by an a single methylene (CH2) group, but from the other two by possessing 2 carboxylate groups. Similarly, Lys differs from the others since it has two amino groups and finally Tyr has a polar aromatic side chain. Let us say that we had 4 separate samples of the 4 amino acids. How could we distinguish between them, rapidly and economically? There are several methods that can distinguish each of the amino acids, but these are not widely available in a typical Life Sciences Laboratory. Mass spectrometry will provide a clear answer, since it is possibly to distinguish between molecules differing by 1Da. Infrared spectroscopy measures differences in the vibrational characteristics of intramolecular bonding and NMR (above right) will readily distinguish between the four amino acids on the basis of differences in absorption characteristics of the protons in an applied magnetic field. One final point is that Tyr will absorb in the ultra violet region, since it has an aromatic ring as a side chain.

 All of the above physical methods are not always available and sometimes samples may be available in too low a yield to obtain definitive results. One of the early methods employed for the analysis of amino acids was to combine paper chromatography, or later thin layer chromatography (TLC) with a range of solvents and to use the molecule ninhydrin, to provide a sensitive indication of the presence of an amino acid. Ninhydrin (top LHS) reacts with primary (and secondary) amines to give a purple colour (I think secondary amines are yellow). If all 4 amino acids are applied to a TLC plate and the plate dipped into a solvent reservoir and allowed to "develop", the amino acids can be separated owing to their differential "retention" by the stationary phase used for the separation (usually silica) on the TLC plate. The result of a typical separation by TLC is shown top right, for a mixture of dye molecules. The term TLC is used for a range of different resins and you can find a detailed discussion here. For the details of the separation of amino acids, follow this link. Briefly, separation can be achieved owing to the difference in the affinity of each amino acid for the silica and its relative solubility in the solvent. As you might imagine, it is easy to separate Tyr from Lys or Glu, but not Glu from Asp.
 On a separate note, because Lys side chains are commonly found on the surface of proteins, ninhydrin can be used in a spray to detect fingerprints. If a person presses their finger onto a surface, small amounts of protein are transferred from the dead skin. By reacting the surface with ninhydrin, otherwise invisible fingerprints are revealed in forensic analysis, as shown on the left. It should also be pointed out that ninhydrin (which is usually dissolved in acetone) is hazardous and must be used in a fume hood, with appropriate safety precautions (eg gloves, mask etc).
The most common method used for the separation of all 20 amino acids (well, 19 since technically Pro is an imino acid) found in proteins, is High Performance Liquid Chromatography (HPLC). We do have such an instrument in the laboratory, but the separation and detection of amino acids requires a specialised chromatography column and definitive detection requires the use of NMR (or one of the other physical methods). Nevertheless, HPLC is a powerful method which employs the principles of TLC in a cylindrical column, with sophisticated pumping systems which can deliver solvent mixtures precisely in order to separate small molecules on the basis of subtle differences in their affinity for the column resin and the solvents applied. See here for a detailed description.
Returning to the lab experiment, you should look up the structures of brilliant blue and safranin dyes, and decide which groups of amino acids share their net charge. Given that the column resin has a net positive charge, which dye should behave like Glu and Asp and which one like Lys? Secondly you should comment on whether the addition of 1M sodium chloride led to the displacement of the dye or dyes and explain your results. When I looked around the lab, everyone seemed to have obtained the expected results, but you must not only report and explain your findings, but you should comment on the choice of methods for separating amino acids and the limitations of the methods available with respect to the small differences in the chemistries of the amino acids. The importance of the definitive nature of the methods of detection should also be covered in your discussion. Finally, chromatography represents an excellent example of the predictability of scientific methodology. The sensitivity of the best methods of chromatography, to subtle differences in the chemical and physical properties of molecules, make it on the one hand a powerful methodology, but on the other places considerable demand on the operator in respect of attention to detail during an experiment!
 This week we started measuring the activity of Glutamate Dehydrogenase in solution, using the reduction of NAD+ to NADH, which gives an increase in absorbance at 340nm. Having made up the stock solutions of glutamate and NAD+, the enzyme (diluted from a concentrated suspension in saturated ammonium sulphate) in phosphate buffer at pH7.6, was added at a volume determined by you to give good initial rates. So what is a "good" initial rate?
The Ugly! I am going to use the "Good the Bad and the Ugly" in reverse order, extending the use of a literary concept, to identify the "Goldilocks" initial rate! This is an unacceptable initial rate. Here something has gone wrong. This might present as no observed change in absorbance: you forgot to add an ingredient, say. (Familiarise yourself with the height of a 1ml volume in your cuvette!). The absorbance starts shooting up in the absence of enzyme. This can occur if your solutions (which may be on ice) create condensation on the optical face of the cuvette. And then, there is the passing increase, as a hair or piece of chocolate floats past the light beam! These represent examples of the ugly side of initial rate measurement! They are all a result of a lack of care!
 The Bad! A bad rate is a rate that is either too fast or too slow to capture. I am referring here to rates measured on general lab spectrophotometers, and in our case we are using good quality specs but in a simple manual mode. Therefore you will take absorbance readings against a blank sample every 15/30s. If the rate is too sow, ie the absorbance changes by 0.001 at each reading, this is bad for productivity (but it may be good for the determination of the tangent). However, on balance we try to obtain good slopes, in a reasonable time scale ( maybe 10 minutes). If the rate is too fast, this is worse. The slope is hard to determine and the reaction is over before you have had time to write down the first absorbance reading!
 Good! When the data are plotted (absorbance versus time) and the first 50% of the plot lies on an approximate 45 degree straight line, you have obtained the Goldilocks conditions! This is a balance of the substrate concentrations and the amount of enzyme added to initiate the reaction. The rate shown below was obtained by someone and is in my view satisfactory. I want to replace this with a post of your rate measurements tomorrow, to highlight the best result in the class and to improve on the one below! If you could show me your initial rates, I'll choose the best!

I was delighted to see the natural product experimental planning taking shape this week. Last year, lemons proved the most popular source of potential ant-bacterials, but this year coconuts are topping the bill! It has prompted me to use coconuts as the backdrop to help with your experimental planning. The first thing I noticed was an overwhelming rush of enthusiasm to make the plant extracts. However, how many of you weighed the item? Did you measure the volume of the coconut (or kiwi fruit etc)? If you did, how did you do it? How did you extract the "milk"? What was the volume? How did you store it?
These were the questions that I asked several groups and the reason for asking is simple. Whenever you embark on an experiment, you must plan to record all of your observations. Before you extract the coconut milk, weigh the coconut. You should then compare (for example) 3 coconuts. Are they the same weight? What is the average weight? The same applies to the volume (think ancient Greeks taking baths!). Ask yourself why these measurements are important.

Now we come to the fluid inside the coconut: the so called coconut milk. Milk is usually defined as the fluid from a mother's breast or from the udder of a cow. It is a mixture rich in proteins and fats. So what is in coconut milk? You should consider the coconut carefully. Define its structure, consider the biological origin of its distinctive structures and then think about the source and composition of the "milk". You should then plan how you make various extracts, with reference to the chemical composition of the various parts of the "nut".

The search for lauric acid (above) was a topic of discussion with two groups. This is one of the therapeutic molecules found in coconut milk. If I tell you that chemistry is full of alternative names for the same thing (trivial and systematic), you may be surprised to find that lauric acid, which is claimed to be of therapeutic value, is very similar to the detergent we use to denature proteins, sodium dodecyl sulphate. So how can two very similar molecules have such different properties!
 What I want you all to do is to measure everything you possibly can before you commit to any destruction of the plant or fruit. Take photos and annotate the structures. Research what is known about your choice of plant and then consider whether you are likely to find water soluble or lipid soluble antibacterials....and how you might plan for both! But don't lose that enthusiasm!!!
 Yesterday, we went through the first of three stages in our preparation of GFP. This involved induction of expression of the GFP gene that was under the control of the inducer, IPTG. Cells were then harvested by centrifugation, and the enzyme lysozyme was added to effect release of soluble proteins including our GFP. The experiment required planning and organisation and I would like to suggest the use of a flow diagram in your lab books to organise your thoughts and to remind you of what comes next in your experiment. In the above example a simple diagram helps identify the key steps and allows you to note the volumes of reagents, times of incubations and can be further annotated with observations. What did the pellet look like? What was its approximate volume? Where there any differences between replicates etc. All of this in my view, helps you get through the experiment quickly and acts as a strong reminder when writing up the experiment at the end.
Key words flow diagram, flow chart, experimental planning, protein extraction, GFP
 The first step in developing a robust system for the production of recombinant GFP, requires knowledge of the growth characteristics of the host organism; in our case Escherichia coli. The standard approach to obtaining this information is to measure the rate of growth of the organism under defined conditions. It may also be useful to determine to what extent factors such as temperature, growth medium composition and pH, vessel configuration, aeration rates etc., influence the yield of cells. The method we shall use, and indeed you have developed yourselves (with a little bit of help), is to monitor growth over time using a spectrophotometer to accurately measure the turbidity (cloudiness) of a liquid culture at a set of well defined time points.
The starting point and the end point of the experiment should be considered in planning your schedule. This is where you need to think carefully about managing your time and organising materials and equipment. I wont give away the method completely, but you might want to think about the following elements of the experiment.
1. What volume of culture should I use? Why?
2. What is the best inoculum to use (loop or defined volume) and how could I determine this empirically?
3. What is the likely time taken for sufficient numbers of cells to populate the culture tube making detection possible. (Hint, you already have your own data on plate and broth cultures). Discuss this with your colleagues.
4. What sample volume is ideal for recording time points?
5. What solution should I use as a "blank"
6. Why did I suggest placing your first sample on ice today?
7. Are there any consequences of depleting the culture during the experiment?
8. What are the growth characteristics of bacterial cultures that have been described in class or on the Internet (e.g. Wikipedia)
9. Should I make single, duplicate or triplicate measurements, or maybe team up with colleagues? Pros and cons?
10. How should I record and plot my data?
11. What should I do after plotting my data?
12. What do other students' data look like and can I rationalise the results?
Key words Growth curve, E.coli, temperature, pH, aeration, spectrophotometry, blanks, culture, medium, planning, time management, organisation
This week has seen us return to bench work and as you know we are set on a course to purify our own Green Fluorescent Protein before Christmas. Over the last few days, you will gave become used to my sarcasm over your economic approach to the use of adjectives? One of the most important aspects of Scientific endeavour is the ability to make careful observations....and record them concisely and quickly. In addition, you should write up your methodology in a way that will enable you (and anyone else)to obtain the same set of experimental results. Finally, you must label all of your samples carefully, so that you can locate your plate or tube after a day, a week or a year, if necessary.
As you will have noticed I pushed you to describe the plates above (well your own poured and inoculated plates) in detail. I was looking for comments on
Percentage coverage of the plate
Distribution of the colonies
Shapes and sizes of the colonies
Colour and appearance of the colonies
Sizes of (and shape) single colonies (did you use the magnifier?)
Number of colonies estimated by "sectoring" the plate
Did the culture have any characteristic smell?
Was there any evidence for contamination?
You can read more at one of my earlier Blog Posts http://utcinnovationlabs.blogspot.co.uk/2014/06/elementary-my-dear-watson.html
Key words Observation Recording findings
 This week we have started BLASTing again in Y12 classes and by the end of the first weekly sessions, all of you will have gone through the basic steps. I walked around at the end of each session yesterday and checked that you had all worked through the CFTR primary structure search and then your own searches looking at the human h(a)emoglobin alpha chain sequence similarities across the species. I wanted to just add a reminder for the two key sites and in particular to encourage you all to sign up for an NCBI account: it will store all of your searches and will be something to show to future employers or University interviewers!
NCBI (and remember to use BLASTp)
PubMed (and remember to select Proteins, from the drop down menu)
 A second tip at this stage is to add terms to refine your search. As I said a thorough grounding in classical languages helps with BLAST. So if you want to compare a sequence from man (eg Histone) add homo. If you are looking for a bacterial DNA Polymerase add coli. This will help you select the correct "hit" from the long list. Finally, check the number of amino acids in the sequence you are looking for. This is given in the summary information for each hit. So a 13 aa sequence is not likely to be correct for CFTR which is nearly 1500 aa (use wikipedia if in doubt to find more info about your query sequence). We shall continue with the introduction-search-discuss-search again sessions over the next few weeks.
Key Words BLAST, Primary structure, sequence alignment, NCBI, PubMed
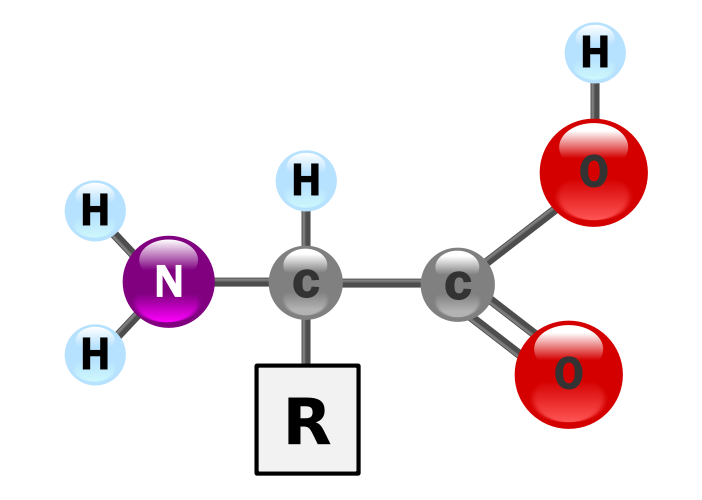 Last week I introduced the idea of using two dyes to illustrate the power of ion exchange chromatography (IEC). The dyes were used instead of amino acids, but served to illustrate how the net charge on a molecule can be used as a means of purifying (preparative ion exchange chromatography) or simply analysing mixtures of molecules, such as amino acids (LHS). Consider the 4 of the amino acids found in proteins: Glutamate (Glu), Aspartate (Asp), Tyrosine (Tyr) and Lysine (Lys). In addition to their shared amino and carboxylate groups (which in large part define their properties as free amino acids), Glu and Asp have a second carboxylate group as the side chain. Thus at neutral pH, they carry a net negative charge. By comparison, Lys is positive, owing to an additional amino group, whilst Tyr is polar, but neutral, owing to the hydroxyl group attached to its aromatic side chain. Look the structures up at the wikipedia site and satisfy yourselves that you appreciate the chemical properties of each amino acid. Forthe purposes of the lab sessions I will focus on IEC, since gel filtration chromatography (sometimes called gel permeation), elegant though it is, has limited application and affinity chromatography is specific (by its very nature) to single classes of proteins. You will also have last year's experimental report on the use of Ni-NTA Affinity chromatography for the purification of tagged GFP. See my Blog here. The use of solvents and silica based resins in thin layer chromatography and high performance liquid chromatography, are discussed below.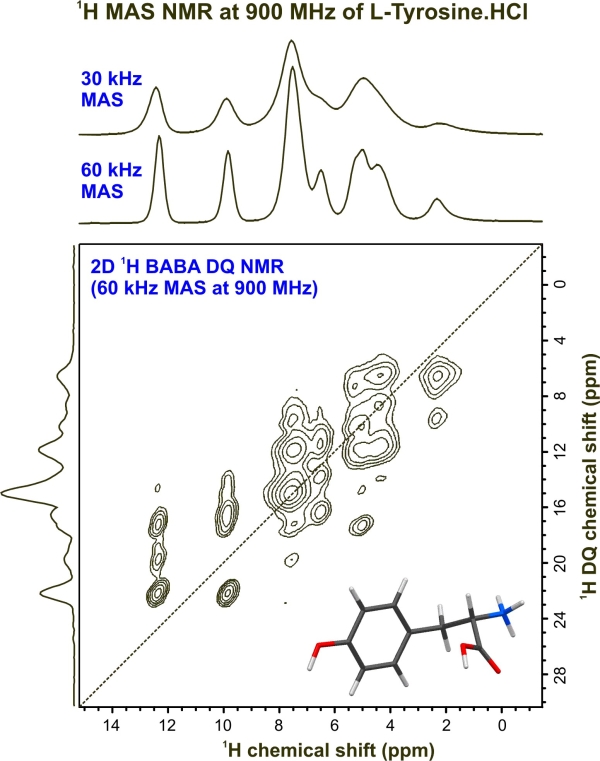
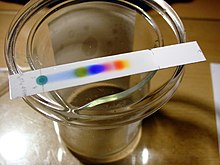
 All of the above physical methods are not always available and sometimes samples may be available in too low a yield to obtain definitive results. One of the early methods employed for the analysis of amino acids was to combine paper chromatography, or later thin layer chromatography (TLC) with a range of solvents and to use the molecule ninhydrin, to provide a sensitive indication of the presence of an amino acid. Ninhydrin (top LHS) reacts with primary (and secondary) amines to give a purple colour (I think secondary amines are yellow). If all 4 amino acids are applied to a TLC plate and the plate dipped into a solvent reservoir and allowed to "develop", the amino acids can be separated owing to their differential "retention" by the stationary phase used for the separation (usually silica) on the TLC plate. The result of a typical separation by TLC is shown top right, for a mixture of dye molecules. The term TLC is used for a range of different resins and you can find a detailed discussion here. For the details of the separation of amino acids, follow this link. Briefly, separation can be achieved owing to the difference in the affinity of each amino acid for the silica and its relative solubility in the solvent. As you might imagine, it is easy to separate Tyr from Lys or Glu, but not Glu from Asp.
  On a separate note, because Lys side chains are commonly found on the surface of proteins, ninhydrin can be used in a spray to detect fingerprints. If a person presses their finger onto a surface, small amounts of protein are transferred from the dead skin. By reacting the surface with ninhydrin, otherwise invisible fingerprints are revealed in forensic analysis, as shown on the left. It should also be pointed out that ninhydrin (which is usually dissolved in acetone) is hazardous and must be used in a fume hood, with appropriate safety precautions (eg gloves, mask etc).


