 The first batch of gels were stained and de-stained this week, revealing some interesting observations and some frustrations. The first thing to say is that the gel on the left reveals that the insoluble fraction (i.e. the proteins precipitated by the addition of an equal volume of 80% (w/v) saturated ammonium sulphate led to considerable enrichment of a low molecular weight protein (the blue blob at the foot of the gel). There are between 3-4 visible bands starting from the point where the stacking gel meets the resolving gel. The latter interface is a point where very high molecular weight proteins or often precipitates collect and these should be ignored here. This leaves a feint band followed by a significant band, approximately half way down the gel. The three bands illustrate that proteins of quite different levels of abundance are precipitated by the ammonium sulphate and that they differ considerably with respect to molecular weight. The blob is the lowest molecular weight of the three protein species. So we have quite a lot of information from this first gel. However, there are no molecular weight markers (from which we could deduce the molecular weight of the three bands) and the gel itself isn't a triumph of lab technique! Let's look at the problems.
 First the gel samples contain a relatively high concentration of salt (you added an equal volume of approximately 5M ammonium sulphate to your protein sample: calculate the salt concentration in the sample you loaded onto the gel). Secondly, this was the first time you have loaded samples onto a gel of this type and it is a little tricky (see the middle lanes of the same gel (RHS). Sometimes samples flow over into adjacent lanes. Nevertheless, despite these issues, which can all be overcome with practice, we can see that the value of ammonium sulphate as a simple method for the enrichment of proteins. In fact whilst it is used to achieve some level of purification, perhaps its greatest value it brings, is in concentrating proteins, which can often help stabilise proteins and keep sample volumes down to manageable sizes. What simple technique could you employ to remove the ammonium sulphate from the sample before applying to the SDS PAGE?
Just a few technical points on the preparation and treatment of the gels. The gel is a polymer which is formed from a solution of acrylamide and bis acrylamide. When ammonium persulphate and TEMED are added to a mixture of acrylamide and bis acrylamide, the acrylamide polymerises and the bis acrylamide forms cross links. By adjusting the concentration and proportions of acrylamide and bis acrylamide, the gel forms a "cross linked net" which sieves the proteins. The gel is often made in two parts, with the lower 75% called the resolving gel (often 10% polyacrylamide) and the upper gel, called the stacking gel, often a lower percentage. The stacking gel sets a little slower and it is into this layer that we push a "comb" which is the same thickness as the plastic spacer that allows us to form the gel between the two glass plates. The comb is removed prior to loading samples (which are typically 5-50ul in volume. The gel forms a bridge between the upper and lower buffer chambers and when the buffers contain the detergent SDS, the proteins are generally electrophoresed in such a way that they run as a range of negatively charged "rods" whose length is determined by their primary structure (number of amino acids).
The sample loading buffer contains a few specific components: bromophenol blue is a dye that doesn't bind to proteins, but allows us to track the samples, ensuring that we don't run the gel for too long. The smell is due to the presence of beta mercaptoethanol, a reducing agent which ensures that those proteins containing disulphide bonds are fully unfolded. Finally glycerol is added in order to facilitate sample loading: the density of the blue protein sample making it easy to load into the wells of the gel, and easy to tell if your sample has spilled over into an adjacent lane. At the end of the electrophoresis phase, typically one hour, the clear gel is removed carefully from between the plates (as I demonstrated) and is covered by a solution of "stain". This solution contains Coomassie Brilliant Blue, dissolved in a mixture of methanol, acetic acid and water (hence the smell!). The dye stains both gel and proteins, and we have to actively destain the polyacrylamide with a similar solution (omitting the dye). The whole process of staining and destaining takes a few hours (often destaining is carried out overnight), and the gel is usually contained in a plastic box and gently agitated. In the next methods blog, I will look at the gels that you obtain after the column chromatography step.
Key words SDS PAGE, sample buffer, ammonium sulphate fractionation gel composition
 Today we ran our first samples from the ammonium sulphate fractionation of milk proteins. The gels are looking fine, but I thought I would remind you of the key principles before we provide the class gels on the Y12 Edmodo site. The acronym, SDS stands for sodium dodecyl sulphate (LHS) and you may notice a resemblance to phospholipids: a long hydrophobic tail, capped by a negatively charged group. This molecule is added to the protein samples in order to stabilise the polypeptide chain in an extended (think of an extended, negatively charged rod, a little like DNA?). This renders most of the proteins identical apart from the length of the rod, which in turn is directly proportional to the protein's molecular weight.
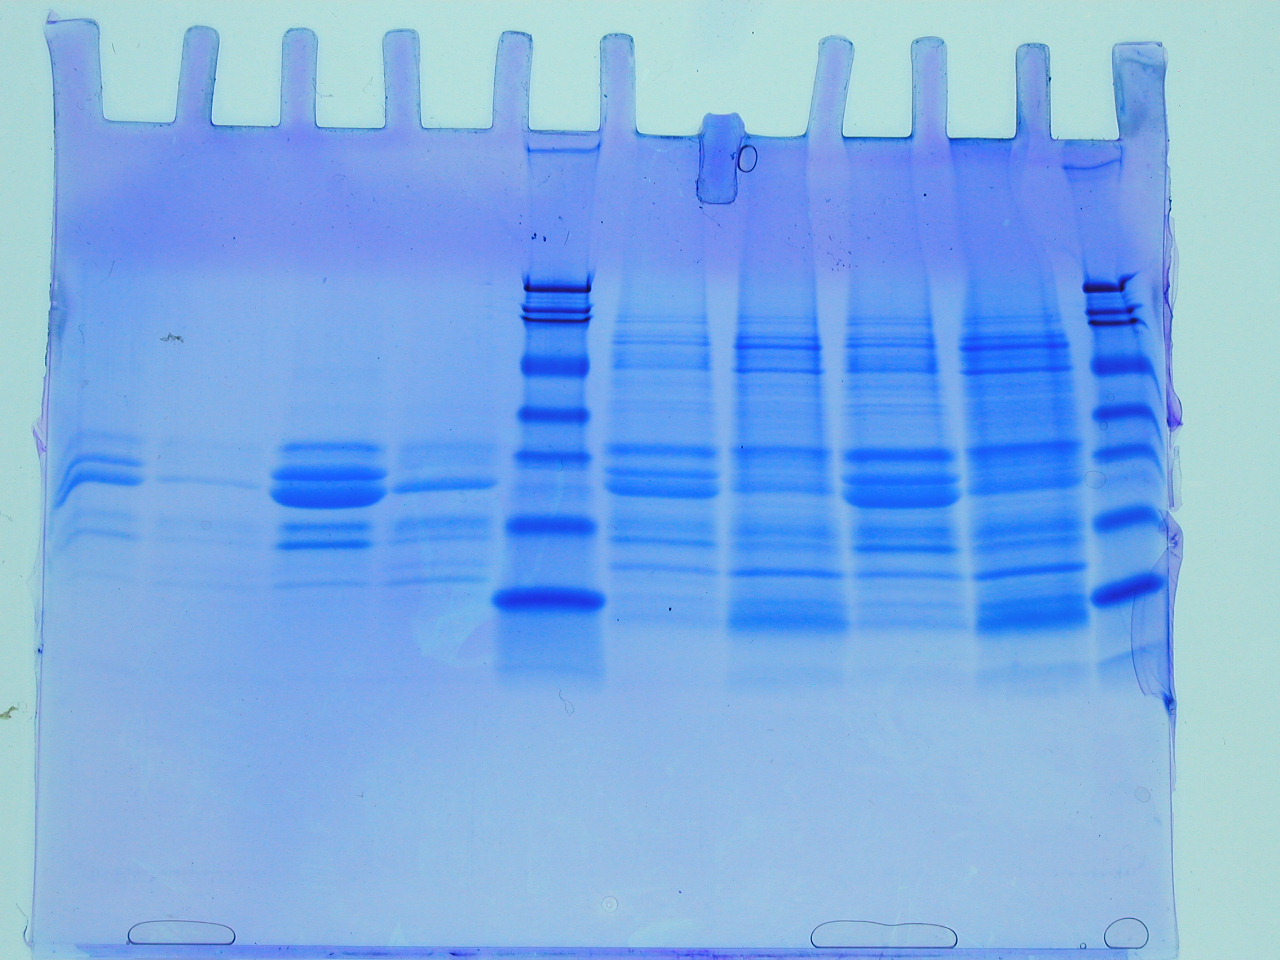 The next part of the acronym, PAGE, stands for polyacrylamide gel electrophoresis. The polymerisation of acrylamide stimulated by TEMED and ammonium persulphate, provides us with a durable medium for the separation of a few hundred micrograms of proteins (of different molecular weights), which can be detected following a staining procedure involving Coomassie Blue, as seen RHS. The banding pattern provides a rapid and sensitive evaluation of the proteins in a sample and is generated as the proteins are separated on the basis of molecular weight differences in the denatured state. It has become a favourite method in all experimental Biology labs since it was pioneered by Laemmli, over 40 years ago (original paper).
Today, we approached milk protein purification empirically and your samples will be as good as the care you took to prepare them. There may be carry over of ammonium sulphate, which can distort the bands, but we shall see soon enough. Some useful tips are:
1. Label and track all samples closely (remember your numbers 1-6 will look the same as those of your colleagues next session!).
2. Take care to add an equal volume of the gel loading buffer (it promotes protein unfolding).
3. Load less than 40ul of your sample and steady the Gilson with one hand. Take your time!
4. Make sure you have recorded the details of each sample carefully and note the lanes on the gel, where your sample was applied.
Key Words SDS PAGE, protein separation, analysis electrophoresis
 For me, liquid chromatography is both an elegant and powerful method for Biochemists. This week we have been looking at its application in the analysis of complex protein mixtures exemplified by bovine milk. In order to familiarise you with the methodology, I have "spiked" the milk with an intense blue dye called "Brilliant Blue" and the resin (column material is often called this by older scientists!) is Fast Flow Q Sepharose. The dye is not only coloured, but is negatively charged, which ensures it binds efficiently to the positively charged beads of the resin (below, RHS). If a bright blue band appears at the top of your column, you know that your experiment is progressing well. It was really nice to walk round and see that hardly any columns had run dry and that the dye began to accumulate as I expected.
 Cell extracts and fluids often comprise many thousands of individual protein species and milk is no exception. The purification of a single protein from such mixtures may seem challenging, but has been successful in many laboratories. However, in our introductory experiment I hope you all observed that some proteins washed straight through the column (theoretically those with a net positive charge, as the beads are positively charged via a quaternary amine, RHS: this is just the same as like poles repelling in bar magnets) and those with a net negative charge remained bound. The bound fraction was eluted (along with the dye) by the application of increasing concentrations of sodium chloride. What kind of column would you use to capture histones?) By refining this process and collecting smaller fractions at a range of salt concentrations we can begin to tease apart the complexity of the mixture. In this way we wont be "wasting pure thoughts on impure proteins" to paraphrase a Nobel Prize-winning Biochemist, Arthur Kornberg!
Key words: ion exchange, chromatography, protein purification, organic dyes
 Today we encountered the use of ammonium sulphate (or sulfate as it is now often written)for the salting out (or precipitation of proteins from complex mixtures. The first thing I want to comment on is planning and its importance in experimental work. We had a visitor from the business world who immediately understood why I had asked the group to stop, think and plan ahead before "jumping in". This is not only important in laboratory science, but is a key transferable skill, whatever you do. Our visitor's delight that this formed part of the lab classes was apparent from the big smile on his face! Please, write out a plan before you begin.
 Secondly, you learnt today that ammonium sulphate is highly soluble and that in order to weigh out a few grams, it is a good idea to grind the salt before weighing. This is something I learnt in the first few weeks of my PhD and I was pleased to see everyone carrying this out without making a mess of the balance area. Really well done.
Dissolving the salt proved valuable experience, since you have probably never made up solutions from scratch. This is a basic skill and one that you have to make mistakes before you realise how best to proceed and how much you need to concentrate to ensure you get the solution to the appropriate concentration.
The use of increasing concentrations (or saturation) of the protein mixture (in this case milk (both skimmed and full),followed by high speed centrifugation was a real success and I hope it made you appreciate the power of such a simple method for concentrating proteins. Those who have yet to repeat the experiment on the full fat milk, should think about the result you might obtain compared with the skimmed milk samples.
This simple method is an industry standard and one that is less widely used in Molecular Biology Labs, but I hope you recognised the power of such a simple method today.
Key words: Ammonium sulphate, salting out, protein precipitation
 As we complete the first round of skills tests for this year's intake at the UTC, I have been impressed by those who have taken ownership and a personal "pride" in obtaining the best quality results. I also have some concerns about the general appreciation of plotting data. In my first post I included a graphic of a plot containing the errors on experimental measurements. I would like to return to this briefly today. On the left you can see a format for breaking the axis in a plot, which can be helpful if the line constructed from measured data needs to be extended significantly towards zero (extrapolated). However, in order to use this device appropriately, you must ask yourself the question: should the line pass through zero? In the case of a plot of absorbance values versus dilutions of a "coloured" compound, the answer is a firm YES. No compound, no absorbance (think of the process you employed to set zero on the spectrophotometer). Therefore, it can be misleading to fit your points to a convincing line, that would not extend to zero. This is bad practise and so care must be taken to avoid this. It is much more important to ask why the line is a poor fit to the data and to repeat the experimental measurements strategically. Responsible and informed use of plotting devices such as this and the appropriate use of scales are fundamental to extracting true measurements (and drawing meaningful conclusions) from experimental data.
Key words Graph, plot, data, scales, errors extrapolation